One of the most awe-inspiring forces of nature is lake-effect snow. The amount of latent energy required to produce the lake-effect convection is astounding, and in some situations, snowfall rates can reach as high as 5 to 6 inches per hour. In this article, we discuss the atmospheric physics, dynamics, and thermodynamics responsible for the enormous snowfall generated in a lake-effect event.
Historic Lake Effect Snowstorm of November 2014
In November of 2014, western New York experienced an historic, long-duration lake effect snow event. That storm occurred in two phases; both of which were very well predicted. The first phase occurred from November 17th to the 19th and dumped up to 5 feet of snow in a very narrow swath, just south and east of downtown Buffalo; while only a few inches fell in town and at the airport (view the NWS snowfall report). View the snowfall amounts.
The second phase occurred on November 19th and 20th, and produced another 12 to 48 inches of snow (again, primarily east and south of downtown Buffalo). All tolled, some places received nearly 85 inches of snow accumulation by the end of the ordeal. Damage was significant and included collapsed roofs, fallen trees, power outages, shortages of critical supplies, thousands of stranded motorists, and 13 people lost their lives. At the peak of the storm, the snow was falling at a rate of 5 inches per hour, with cloud-to-ground lightning, and gusty winds up to 50 mph.
Ingredients for Lake-Effect Snow: How It All Works
As I mentioned above, an enormous amount of energy is required to generate such vigorous convection. As with tropical storms, the energy for the formation of lake effect snow is derived from atmospheric instability and warm water. The rest of this piece is a discussion of the dynamics and thermodynamics of lake-effect snow, using the November 2014 event near Buffalo as an example case.
Time-lapse of the lake-effect snow near Buffalo, NY on November 18, 2014
The clouds associated with lake effect precipitation can have depths on the order of several miles and have large vertical velocities. These events have a similarity with thunderstorms in that they are both driven by atmospheric instability/convective available potential energy (CAPE); however, lake effect snow events require comparatively less CAPE than is required for general thunderstorm development. The CAPE that is released during lake effect snow events is generated as polar or arctic air moves over a warm lake. The destabilization occurs as a result of the temperature differential between the air and the lake water. The greater this differential is, the greater the destabilization. Often, these events contain lightning.
➡︎ View the upper-air data for Buffalo from 6 am EST Tuesday, November 18.
There are many factors that affect the development of lake effect convection in general, but especially lake effect snow. For general convection, the temperature lapse rate between the surface and the 850-mb level should be at least dry adiabatic (10°C/km). The water temperatures of the underlying lake should be at least 13°C warmer than the 850-mb temperature. In addition to these conditions, the length of the fetch is also important. Typically, a fetch that is parallel to the lake’s major axis is the most important. In general, the fetch must be at least 75 km in order to produce lake effect snow.
Wind speed and shear are also important factors. The organization of lake effect precipitation is influenced partially by the angle at which the wind crosses the lake. The difference between the direction of the mean wind and the mean wind shear is usually less than 20 degrees. For the heaviest events, strong winds blow parallel to the major axis of an elliptically shaped lake. Bands of lake effect snow can be 15-30 miles wide and 30-120 miles long.
Prevailing Wind Fetch & the Orientation of Lake Snow Bands
We’ve discussed what causes lake effect snow, but now we want to talk about the orientation of the bands. To learn about the differences between single and multiple snowbands, click here.
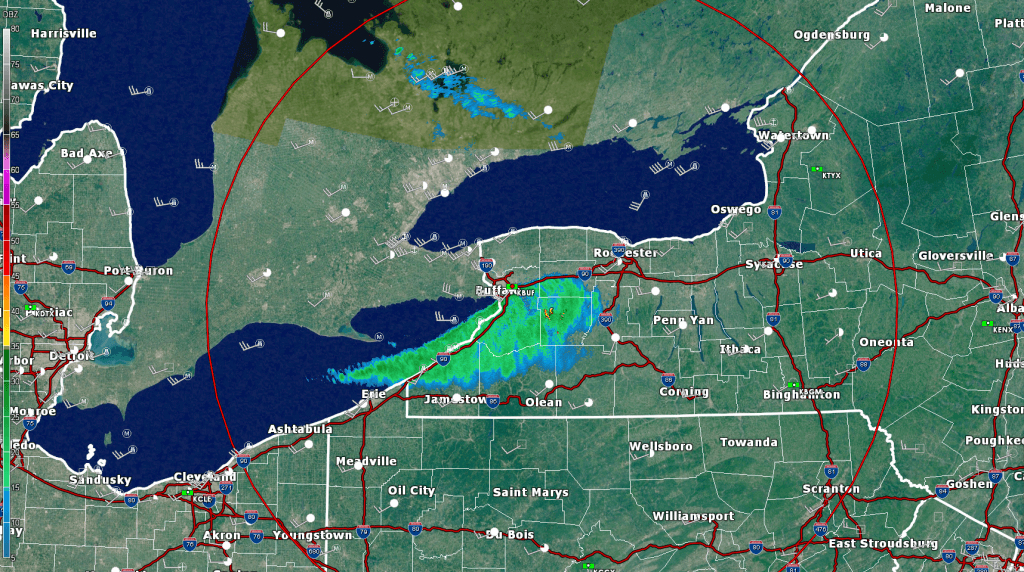
For this discussion, let’s look at a radar image from the Buffalo, NY radar.

The bands of snow are oriented southwest to northeast. To explain why the band is oriented this way, we need to introduce two terms: geostrophic wind and thermal wind. The geostrophic wind is a theoretical wind that exists when the Coriolis force balances the Pressure Gradient Force. This is the case when frictional forces are negligible. On a constant pressure surface, the geostrophic wind is parallel to the height contours with lower heights to the left of the geostrophic wind vector. Below is the 500-mb analysis from this morning with the geostrophic wind vector over western New York in red.

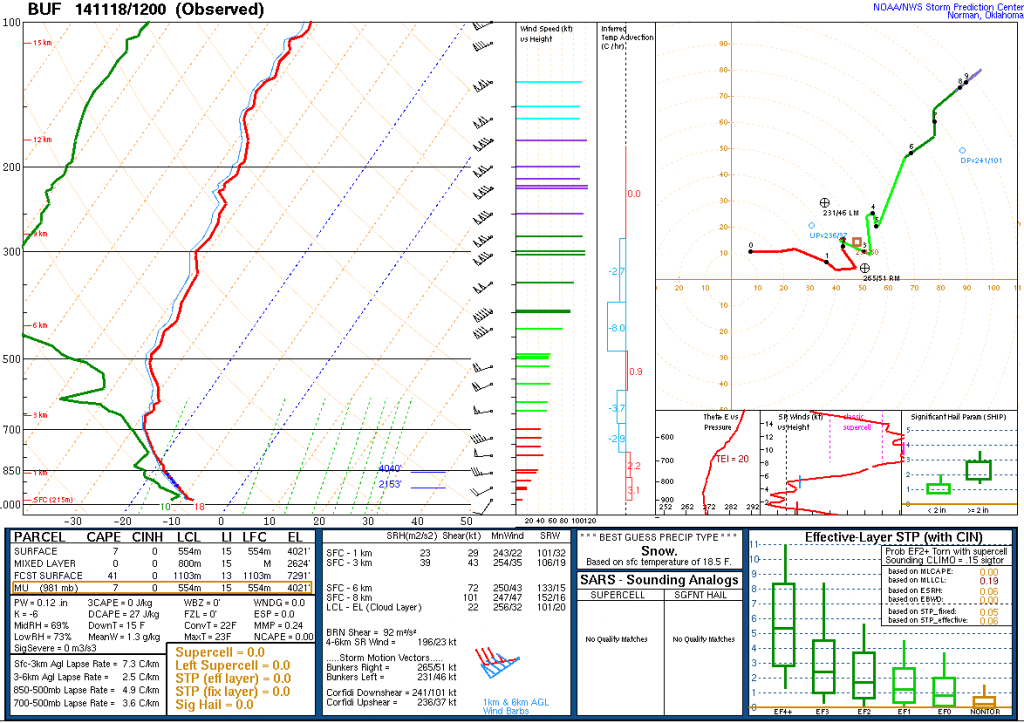
The thermal wind is related to the geostrophic wind in that it is the vector difference between the geostrophic wind at an upper level and the geostrophic wind at a lower level. When there is little to no change in direction, the direction of the thermal wind vector is approximately the direction of the geostrophic wind vector. Looking at the wind profile from this morning’s Buffalo, NY sounding, the winds are predominately from the southwest and as a result, the snow band is roughly oriented from southwest to northeast, as can be seen on the radar image. Below is the sounding from 6 am EST Tuesday, November 18.
Significant instability is also evident on the sounding, which is favorable for thunderstorms and excessive snowfall rates of 4 to 5 inches per hour. In fact, the ground reports within these snow bands confirmed that thundersnow was occurring.


Forcing Mechanisms for Heavy Lake-Effect
Vertical motions within the dendritic growth zone (DGZ) is critical for the production of heavy snow. Vertical ascent is a term for the upward atmospheric motions that result from the forcing provided by various atmospheric disturbances and other lifting mechanisms; both the temperature (discussed above) and the vertical ascent within dendritic growth zone determine the snow-to-liquid ratio.
Examples of Forcing Mechanisms for Vertical Motion
- Upper-level disturbances
- Isentropic lift (a.k.a., “overrunning”)
- Frictional convergence
- Upslope flow
- Convection
For the formation of lake-effect snow, all of these forcing mechanisms are present. Large-scale forcing (vorticity advection aloft) can destabilize the atmosphere by cooling the upper levels and raising the level of the capping inversion. Also, as indicated in the image below, frictional convergence (onshore flow interacting with the landmass is forced upward) and upslope flow (the fetch moves over the topography toward higher elevations) both enhance vertical motions. Convection is particularly important for a significant lake-effect snow event. Convection results from atmospheric instability, and enhances any pre-existing vertical motions from large-scale forcing. Ultimately, when all of these forcing functions are considered collectively, you begin to establish a conceptual model of how lake-effect snow works.

Convective Instability

The image above shows the upper-air data from Buffalo, NY at the onset of the historic lake-effect snowstorm in November 2014. As discussed above, there was a significant temperature lapse rate, which is the rate at which temperature decreases with height; the steeper the lapse rate (i.e., the more rapidly the temperature decreases with height), the less stable the atmosphere is. In this case, there was significant instability present, and this aided in convection over the relatively warm lake waters.
In the lake-land diagram above, we note the moisture flux from the warm lake waters into the extremely cold air above it. We see often see this on very cold days, when a cold steam or low fog forms over relatively warm, open bodies of water (such as swimming pools, ponds, and lakes). As a very long fetch of extremely cold air flows lengthwise over a large and relatively warm lake, the fetch consumes an enormous amount of latent energy derived from the warm moisture flux from the water into the overlying cold air. This further destabilizes the atmosphere, and generates convection. As those convective plumes develop within the fetch, the upward forcing is further enhanced through frictional convergence and upslope over the land. All of these contributed to the enormous snowfall rates of 3 to 5 inches per hour during this recent event. In fact, lightning and thunder were also reported, and were caused by the convective component. So how do we estimate the snow-liquid ratio? Most of the rain/snow gauges in the area are covered in snow and cannot assist us in our endeavor to determine the ratio. So, we must go back to the DGZ and look at the temperature profile.
Snowfall Rates During Lake-Effect Events
Let’s take a look at the sounding with the historical 2014 lake-effect snow event was at its peak (Tuesday evening, November 18, 2014). At this time, the DGZ was from approximately 850 mb to 700 mb, with a minimum temperature in that layer of approximately -15ºC at 725 mb. The average temperature in this layer appears to be around -10ºC. Using -10ºC as the reference temperature for this event (again, this is only a snapshot at one point in time/space). Referring to the chart above, we can conclude that snow-to-liquid ratios were on the order of 10-to-1 (10 inches of snow per 1 inch of liquid equivalent).
This ratio is important because it gives us a rough idea of how much liquid is in the snow and helps us determine the following:
- The snowfall rate
- The total depth to which the snow may accumulate
- The potential for flooding should rapid melting occur
- The potential for power outages if wet snow accumulates on power lines
A 10:1 ratio signifies that for every 10 inches of snow, there is one inch of water. In the areas that received 70 inches or more of snow in our example case, this equates to 7+ inches of liquid equivalent. Of course, that calculation assumes a constant snow:liquid ratio during the event. Clearly, if there is 70 inches of snow with high liquid content, flooding is a real concern once melting occurs – particularly if the melting is rapid. I stress again that this is a computation made from a single snapshot of the atmosphere (sounding). For us to really know the liquid equivalent, we would have to melt a volume of snow in a controlled setting or perform a complete analysis by integrating the changing thermodynamic profile over the duration of the event (to account for changes in temperature/moisture, etc. as the event evolved).

Snow!

Snowfall Amounts 11/19/2014
Here are observed snowfall amounts at the end of the first wave (Wednesday, November 19, 2014):

