Note: The purpose of this post is to share advanced forecasting techniques, not present formal research at this time.
Example Case: April 17-18, 2016 Heavy Rain Event in North Texas
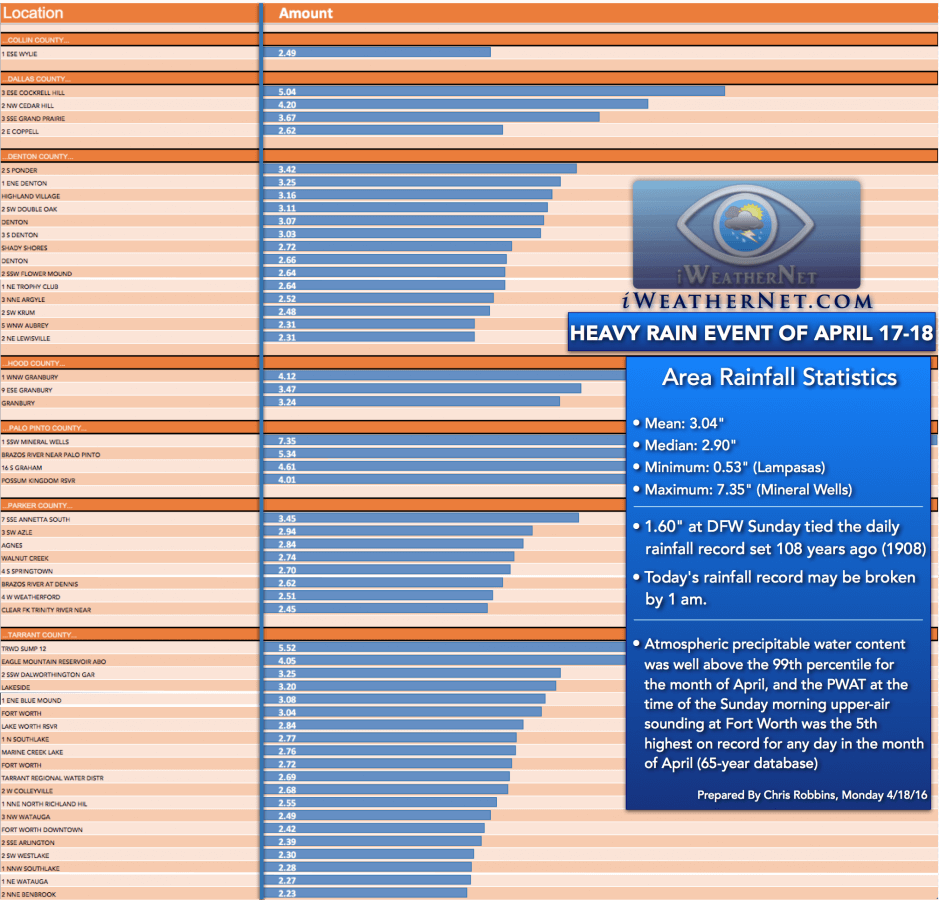
◙ I wanted to show some of the 48-hour rainfall amounts as of 7:00 am CDT April 18, 2016 (officially spans a 48-hour period; but for most of us, the heavy rain fell over a 24-36 hour period).
◙ My list was *much* longer, but I eliminated about 50% of the reports so I could fit a reasonable sample (primarily the metroplex and adjacent counties) in the chart below.
◙ I started with 458 reports. Only 63 of those were under 2 inches (13%). Half of the 458 were greater than 3 inches.
North Texas Event Statistics
• Mean: 3.04″
• Median: 2.90″
• Minimum: 0.53″ (Lampasas)
• Maximum: 7.35″ (Mineral Wells)
• 1.60″ at DFW tied the daily rainfall record set in 1908
North Texas’ 8th-highest April PWAT
Atmospheric precipitable water content over North Texas was well above the 99th percentile for the month of April, and the PWAT measured by the 12z Fort Worth upper air sounding on Sunday April 17, 2016 was the 8th highest on record for any day in the month of April (65-year database).
- Max PWAT for April 17-18: 1.55″
- 99th Percentile: 1.55″
- 90th Percentile: 1.24″
- Median: 0.82″
- Observed on April 17, 2016 at 12:00UTC: 1.74″
Why the 99th percentile?
Those who have followed my forecasts for a while know that atmospheric precipitable water content at or above the 99th percentile always gets my attention. My own research and experience have shown that the 99th percentile is not only significant, it’s a critical threshold.
I rarely make a fuss when atmospheric PWAT is at the 90th percentile. However, there appears to be an order-of-magnitude increase in the risk for flooding as PWAT increases from the 90th or 95th percentile to the 99th percentile… it may not seem like a big difference, but the mathematical, physical, and observed ramifications are significant.


